Here we are at Election Day. It’s been a long road. At some point along the way I thought I’d be doing one of these every night as the election got close. Unfortunately, that ran straight into my need to make a living. But here’s one final probabilistic analysis as the campaign draws to a close.
The Traditional Version
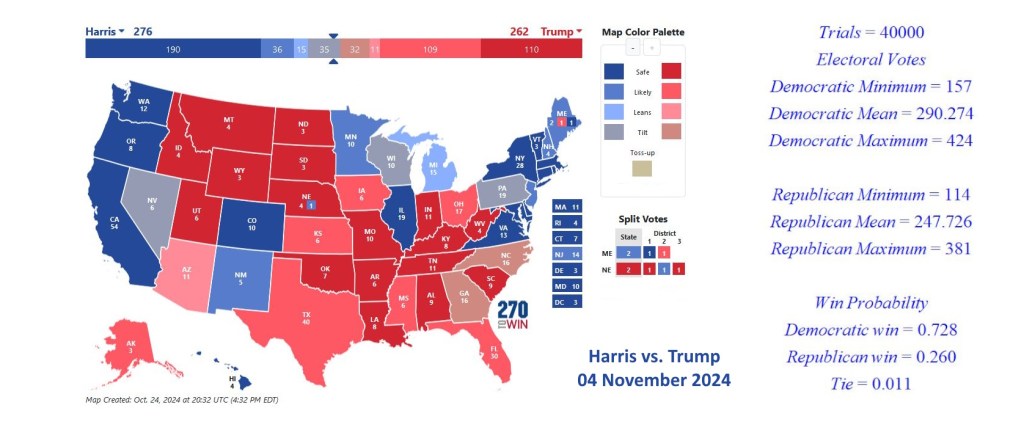
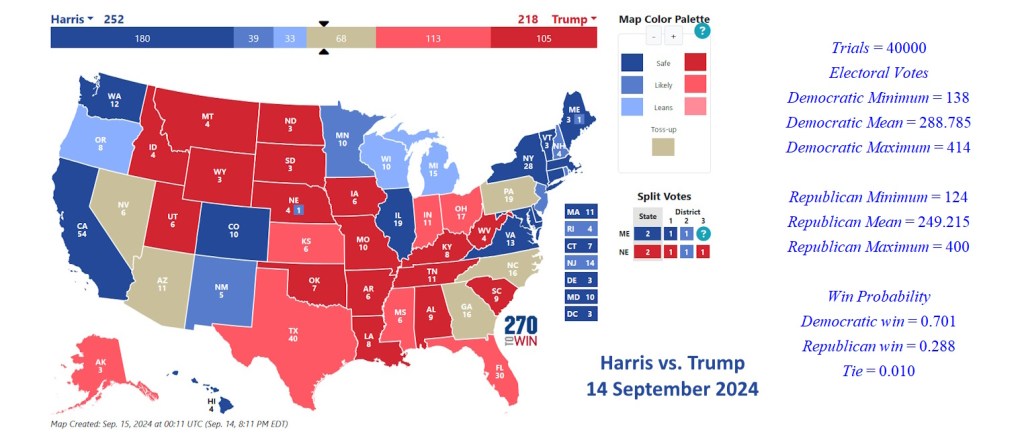
Let’s remind ourselves how these work. I took data for electoral-vote.com either averaging the polls from the last fifteen days or taking the single latest poll if there are no polls in the last 15 days.
We ran 40,000 simulated elections and tallied the results. We ended up with almost 73% of victories going toward Kamala Harris. Running all the states it looks like Harris has at least a 70% chance of winning with less than a 30% probability. I’ve talked about why that is likely an overestimate of Harris’s chances.
That’s why we started running a second simulation.
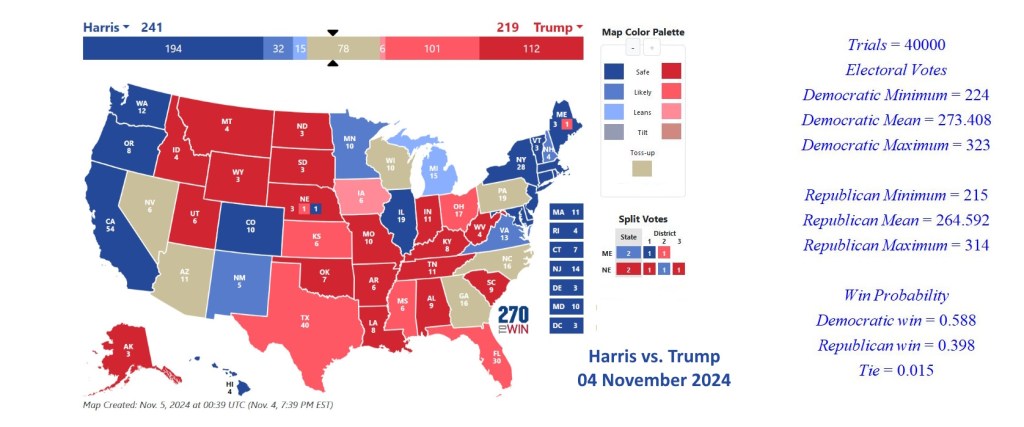
In our swings-only projection we give every state that is not a swing state to either the Democratic or Republican candidate. That means Harris starts at 226 electoral votes and Trump builds from 213. That’s a slight advantage for Harris.
These simulations give us a 59% probability of a Kamala Harris victory and about a 40% chance of winning for Donald Trump. That’s close but not so close as projected by other sites. It’s going to be a long night but Harris has an edge.
Having a day job can be a drag, I promised myself that I would keep up with these but, as usually happens that intention was trampled by the sheer amount of work generated by the college and my classes. If I publish these as much as I’d like as the election draws nearer, most updates will need to look more like this.
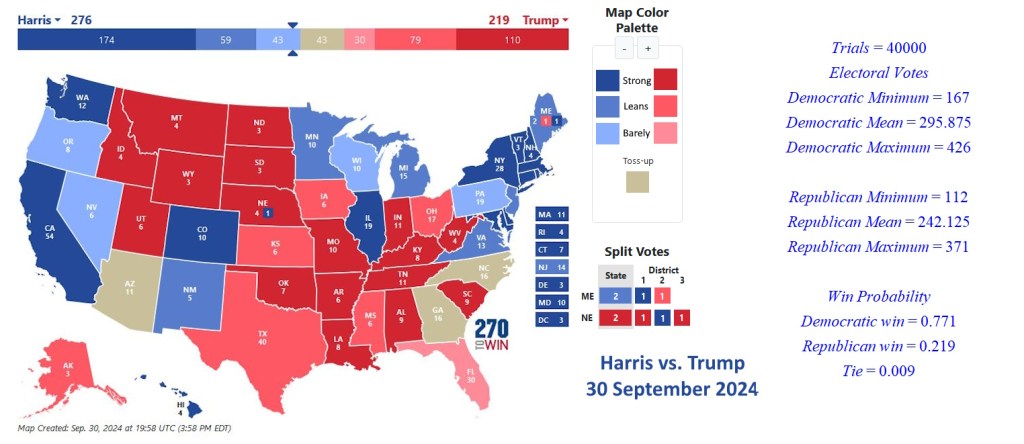
Any commentary I would offer would be stale, but here is the map (in the featured image), the shifts, and the results for the 30 September Data.
You can get a better look at the featured image on the blog.
Shifts:
State
Change
New Mexico
Strongly Democratic to Leaning Democratic
State
Change
Nebraska 2nd
Leaning Democratic to Strongly Democratic
Michigan
Barely Democratic to Leaning Democratic
Nevada
Toss Up to Barely Democratic
Results
It’s reasonable to characterize this as roughly 3 to 1 in Harris’s favor.
Last Words
These probabilities are still mostly driven by Harris’s advantage in the Dark Blue vs. Dark Red categories. Florida and Oregon are also probably shifting back and forth more than is reasonable.
Let’s get right to it. This is the first time since 14 August that one of the candidates had led in a victorious number of electoral votes.
The State of the Race
It’s been another crazy week.
It turns out that the happening at Trump’s golf course in West Palm Beach wasn’t random passersby engaging in gunplay. There was someone with an AK-47 at the edge of the golf course as Trump approached the fifth hole. The only gunfire though came from the Secret Service. The perpetrator was quickly apprehended. This is certainly an incident, but lots of folks are stopping short of calling it an “assassination attempt.”
Most of the polls this week have been very helpful for Vice President Harris. In fact, of the 12 polls that showed up on electoral-vote.com on Thursday, Donald Trump only led in one. There was a tied result in Pennsylvania, and the rest favored Harris. We could be seeing a debate bump finally taking hold.
In light of this, we notice that there has been a spate of anti-democratic stories this week. The Georgia elections board has mandated that ballot be counted by hand. That will grind the process to a halt and create chaos. In Ohio, the Secretary of State has written a very misleading description of an anti-gerrymandering amendment that will be up for a vote. And Senator Lindsay Graham has gone to Nebraska in hopes of convincing their legislature to switch the way, they allocate electoral votes to a winner-take-all system. Part of running a free and fair election involves not changing the rules late in the game, making this Nebraska thing seem like dirty pool. There’s more that I’ll leave you to hunt down.
Results:
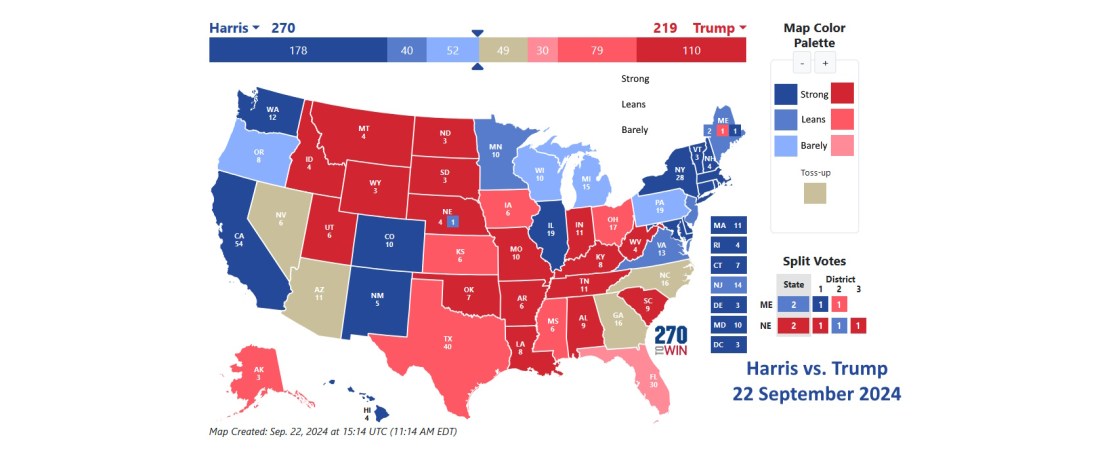
As always we ran 40,000 simulations of the election as though it were being held today based on this week’s polling data from electoral-vote.com. Harris won 75% of these simulations, Trump won 24% and the remaining 1% were tied. In other words, it looks like the odds of Harris winning the election are at 3 to 1.
You can understand why Lindsay Graham went to Nebraska. If this map is correct, even if Donald Trump were to win every state marked as a tossup Harris would win 270 to 268. Changing how Nebraska allocates its electoral votes turns it into a 269 to 269 tie.
Probably not though because Harris is slightly ahead in Nevada and North Carolina. If we add in how the tossup states lean, this becomes a victory for Harris 292 to 246 EV.
That’s not a great way of looking at it though because in addition to the tossup states, the light blue and light red states are all close to or inside the margin of error. That excludes Oregon. We only have one poll from Oregon and it’s not as light blue as it seems.
The optimum way of looking at this might be Harris: 226, Trump: 189. Harris’s 3 to 1 odds notwithstanding this could still go either way.
Trends:
Digging in state-by-state, we can see that the bulk of the shifts this week are good news for Vice-President Harris. Let’s start with the states that have a redshift.
State
Change
Indiana
Leaning Republican to Strongly Republican
Maine 2nd
Leaning Democratic to Leaning Republican
Maine
Strongly Democratic to Leaning Democratic
Virginia
Strongly Democratic to Leaning Democratic
Like Colorado and Arkansas last week, the shift in Indiana doesn’t tell us anything that we didn’t already know. Last week’s result was based on one that was months old and just didn’t capture how red Indiana really is.
The shift in Maine’s second district is a big one, but it puts the Maine 2nd more or less back where it had been before the previous poll. That’s not really a surprise. Because of the change in the Maine 2nd, Maine as a whole seems a little less blue. Virginia’s shift is a small one right at the borderline between those two categories.
State
Change
Iowa
Strongly Republican to Leaning Republican
Florida
Leaning Democratic to Barely Republican
Pennsylvania
Toss Up to Barely Democratic
New Hampshire
Leaning Democratic to Strongly Democratic
New Mexico
Leaning Democratic to Strongly Democratic
Rhode Island
Leaning Democratic to Strongly Democratic
Looking at these states with a blue shift the one non-story here is Pennsylvania. That’s just a happy little dance within the margin of error.
Iowa though was a surprise. Donald Trump had an 18 point lead that shrunk to meager four points. The race in Florida, meanwhile has looked like it’s been tightening for a while. Perhaps it really is.
New Hampshire, New Mexico, and Rhode Island all could be the same story as Indiana. All of the states though have been polled multiple times; New Hampshire and New Mexico were looking downright swingy for a while. If these three are legitimately safely blue that frees up some resources that could be better used in, to pick a couple of states at random, Iowa and Florida.
Last Words
As much as I would rather continue to pontificate here, there is unfortunately other work I need to get to. We’ll check in again next week and see if these trends continue.
This is my first update on my new schedule. I downloaded the data from ElectoralVote.com yesterday, the 14th, at around noon and I’m processing it today on Sunday. With luck, I’ll have this out tonight.
The State of the Race
It’s been a bizarre 10 days! Monday seems like a lifetime ago. It was on Monday when I clicked on a “Cats for Trump” hashtag on Twitter or whatever the hell it’s called now. It struck me as pitiful. It seemed like Trump’s people were out of ideas and were trying anything to move the needle or slow Harris’s momentum.
Tuesday was the debate. It was a solid and clean win for Harris. We got the Trump we saw in the first debate and his furious firehose of falsehoods. That should have been disqualifying then, but we and the media were too busy realizing that President Biden is an octogenarian. In the second round, we got more of the same from Donald Trump with the added bonus that Kamala Harris was really able to piss him off. That led to some crazy, incoherent rants. It turns out it’s pretty easy to push that guy’s buttons as Vladimir Putin and a bunch of others figured out long ago. The only people I saw arguing that Donald Trump won the debate were on right-wing websites where they probably didn’t have the option of saying anything else.
Unfortunately, there are so few undecided voters at this point that the debate didn’t move the needle immediately. As things get played over and over over on the teevee machine some stuff will reach critical mass and start to sink in. A debate bump does not need to be instantaneous.
Oh. Also, the debate and a crudely made AI likeness inspired Taylor Swift to finally endorse Kamala Harris. Trump responded by saying that he hates her while making a knockoff of one of her concert T-shirts. This will eventually be hilarious, but not for Trump.
The latest news is that there was gunfire this afternoon near Trump’s golf course in West Palm Beach. I knew that neighborhood or did 20 years ago. It’s fine, but gunfire isn’t all that surprising. The Trump campaign tried to color this as a second assassination attempt. I guess we’ll see.
Results:
We ran our usual 40,000 simulations of the election. If the election were today it looks like Harris would win about seven out of 10 times. Trump’s chances are close to three out of 10 and as usual we’re seeing about one percent of the results turn out to be ties.
That seems to track. Harris’s collection of “safe” votes is growing and is nearly twice as large as Trump’s. That’s a big driver of the probability. Make no mistake, there are enough toss-up votes that this thing could go either way.
Trends:
We can go back to tracking the individual changes because we’re on our second week of taking polls back 15 days. We have apples-to-apples comparisons. I’ve split the shifts into the moves toward the left and the moves toward the right.
Colorado and Arkansas don’t really show us any recent changes. Those states have probably been in the strong columns for months. It’s just that they haven’t been polled in a long time. We’ll see the same thing when we finally get new polls from Oregon and Indiana.
State
Change
Colorado
Leaning Democratic to Strongly Democratic
Virginia
Leaning Democratic to Strongly Democratic
Michigan
Toss Up to Barely Democratic
Ohio
Strongly Republican to Leaning Republican
Michigan and Wisconsin don’t tell us too much either. These are small shifts on the edges of the categories. Light blue, light red, and taupe are all mostly inside the margin of error.
State
Change
Wisconsin
Leaning Democratic to Barely Democratic
Arkansas
Leaning Republican to Strongly Republican
Virginia and Ohio on the other hand are pretty big shifts and are mostly in Harris’s direction. Ohio doesn’t look likely to turn blue, but if it shifts into a place where it’s competitive and Virginia settles into being safely blue that could inspire a potentially game-changing shift of resources.
Last Words
Kamala Harris having a seven out of 10 chance of winning the election if it were held today seems pretty reasonable at this point. Nate Silver this week has those probabilities almost exactly backward, with Trump having about a seven out of 10 chance of winning. On the other hand, I spent some time this afternoon listening to Christopher Bouzy on Spoutible, revealing his new electoral map. That one seems wildly optimistic in Harris’s direction.
But both of those guys are trying, something more robust than a polls-only estimate. They’re trying to factor in other information, which is more subjective. That might explain why these two projections differ so strongly. The two approaches should theoretically converge as we get closer to election day. In the meantime, I should take a dive into their reasoning to see if I can assess it. Right now I’m comfortable being in the middle.
Yeah, it’s taken me a while to get this one out, again. Sorry. It’s been tricky settling back into the academic year.
Starting this week I will download polling data on Fridays and, with luck, will have a post for you on Saturday. Look for our next update on or around the 14th.
That thing about a week being an eternity in politics has never seemed more true. Donald Trump’s visit to Arlington National Cemetery was a bit more than a week ago, but that’s still within the data collection for this update. It’s been a crazy week or so.
The State of the Race
One thing that surprised me was Nate Silver’s announcement on Thursday that according to his model, Donald Trump had about a 60% chance of winning the election. Silver is doing something fundamentally different than I’m doing here. He’s trying to bring fundamentals and other factors into his probabilities while I’m just looking at poll numbers.
I just do not see it. And whereas good poll numbers are based in fact, I worry that trying to factor in other fundamentals doesn’t. A lot of it, I believe, is guesswork at best and wishful thinking (or existential terror) at worst.
Let’s look at what happened over the past few days over at electoral-vote.com. On Thursday Pennsylvania shifted from barely Democratic to toss-up. Friday’s map had Pennsylvania back at barely Democratic, while Georgia moved from barely Democratic to toss-up and North Carolina moved from barely Republican to toss-up. Yesterday, Texas moved from leans Republican to barely Republican. That sounds like a big deal until you dig into the data. In this case, the margin shrank from five points to four. It is, to paraphrase the Bard, much ado about very little. The website 270 to Win moved Texas and Florida from red to toss-up on Friday. Here’s their “Polls Only” Map.
If this is correct there’s a lot of open ground where either side can grow. Are Trump’s chances of victory improving? That’s harder to say.
Results:
I was pondering a change in methodology last week. I’m only making one change. I’m now reaching back 15 days to gather my polls rather than 10. Some of the polls on Electoral-Vote.com collect data for a month. Since the date on EV’s polls is the midpoint of the data collection, those would never get included with any window shorter than 15 days.
This will also keep more polls in the data set and reduce the chance that one extreme or outlier poll will skew the data.
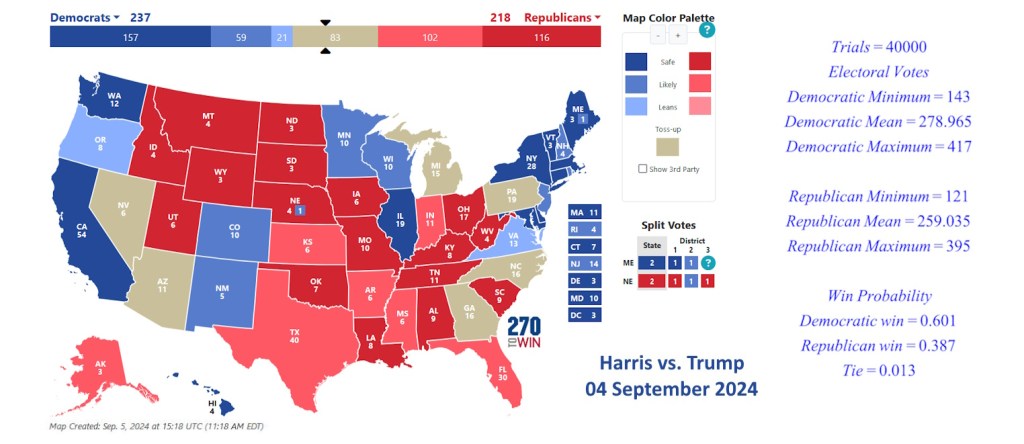
As usual, we entered the polling data into our model and ran 40,000 simulated elections. Here’s what we get.
More states are showing as “Toss Up” than our recent updates, but light red, light blue, and taupe are very close together; this is not a dramatic change.
The results of the simulations tell us that the probability of Harris winning if the election were held today sits at 60% while Trump’s likelihood of victory is about 39%. One percent of the simulations ate ties.
This is where our results have been for a while, Harris still has a slight lead and the odds of her winning remain at about 3 to 2. But wait.
Trends:
I shifted methods so I’m not going to list the week-to-week changes. In the Electoral-Vote.com data, there’s some slight tightening in the race as evidenced by the larger number of toss-up states. Since I collected this data there was Nate Silver’s election probability, Trump’s pulled ahead on at least one betting site and Trump led the latest NYTimes/Siena College poll. Contrarily Harris is ahead in the FiveThirtyEight analysis with a 54% chance of victory.
We might be looking at a 50/50 race in out next update, but from our vantage point, the race as a whole seems stubbornly stable. In our model Harris’s advantage is driven by how many more electoral votes remain in the “Strongly Democratic” column vs. it’s “Strongly Republican” counterpart. Want to move our numbers? Get us a fresh poll in Indiana or Oregon depending on which side you’d like to help.
Last Words
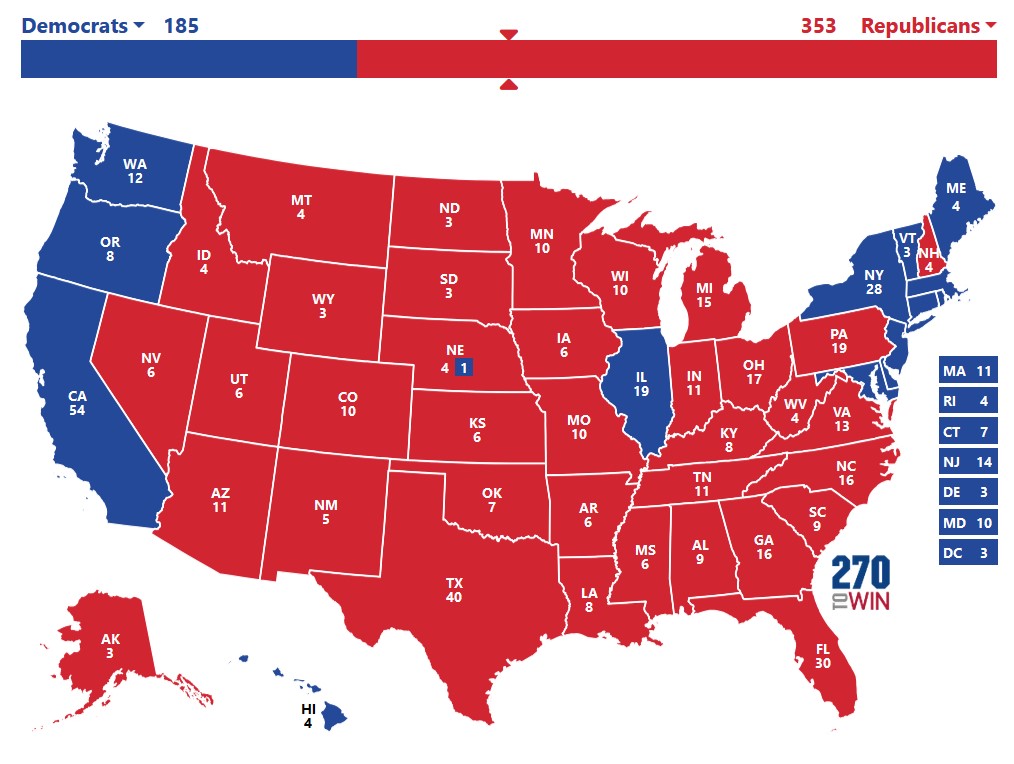
I looked at something a little different this week and it’s interesting. While most of our analysis seems centered on the close races, let’s look at the ends of the red/blue spectrum. I ran a set of 1000 simulations and looked at the biggest landslides. The best result for the Republicans was a victory of 353 EVs to 185. The biggest win for the Democrats was 398 to 140. The maps for these might look something like this.
Neither of these are are going to happen; we won’t get close to either without a systematic polling error. Still, these look a lot more reasonable in the light of 270-to-Win’s polls only map; if you assume all the Toss Ups fall in one direction you get a Democratic victory of 390 to 148 or a Republican victory of 328 to 210. Stay tuned.