The Finish Line.
Here we are at Election Day. It’s been a long road. At some point along the way I thought I’d be doing one of these every night as the election got close. Unfortunately, that ran straight into my need to make a living. But here’s one final probabilistic analysis as the campaign draws to a close.
The Traditional Version
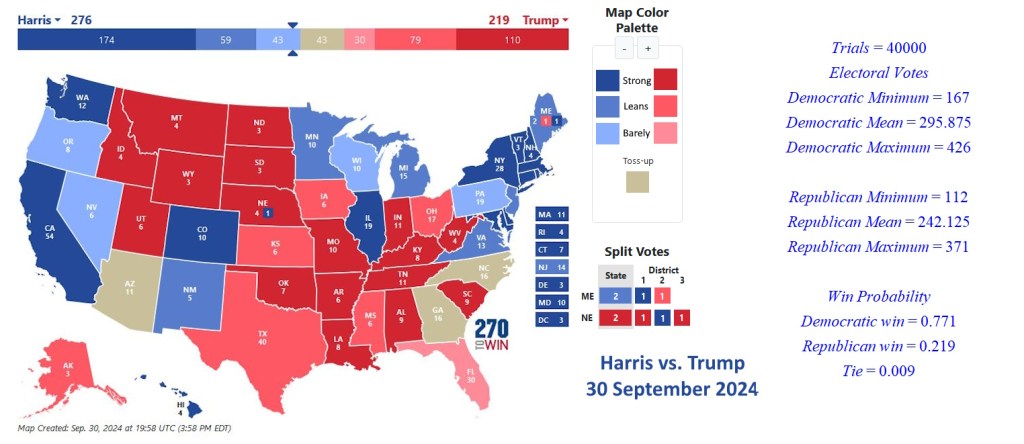
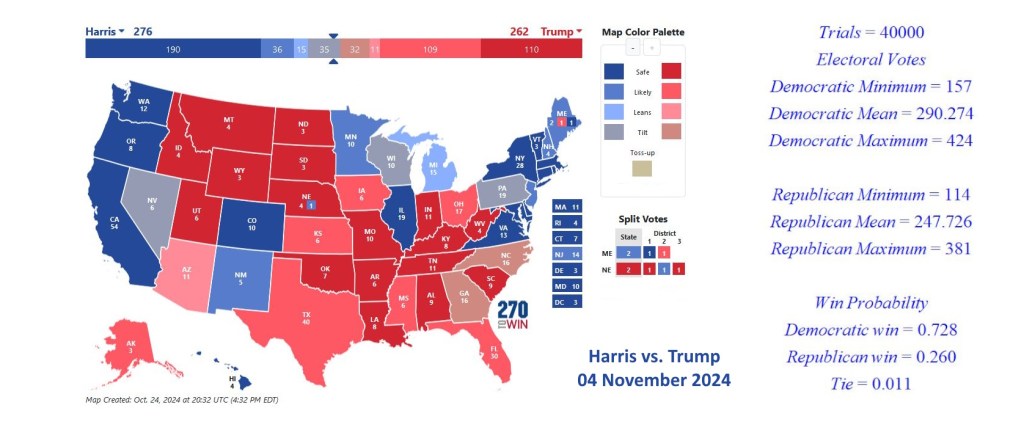
Let’s remind ourselves how these work. I took data for electoral-vote.com either averaging the polls from the last fifteen days or taking the single latest poll if there are no polls in the last 15 days.
We ran 40,000 simulated elections and tallied the results. We ended up with almost 73% of victories going toward Kamala Harris. Running all the states it looks like Harris has at least a 70% chance of winning with less than a 30% probability. I’ve talked about why that is likely an overestimate of Harris’s chances.
That’s why we started running a second simulation.
In our swings-only projection we give every state that is not a swing state to either the Democratic or Republican candidate. That means Harris starts at 226 electoral votes and Trump builds from 213. That’s a slight advantage for Harris.
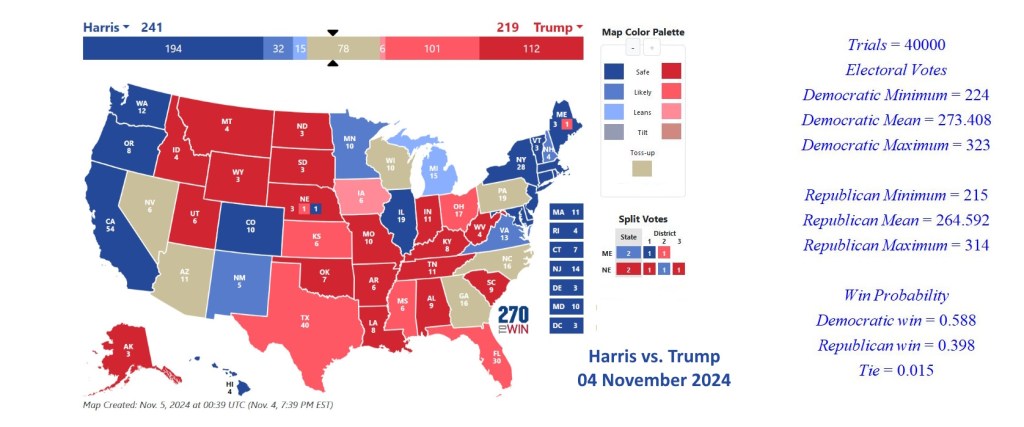
These simulations give us a 59% probability of a Kamala Harris victory and about a 40% chance of winning for Donald Trump. That’s close but not so close as projected by other sites. It’s going to be a long night but Harris has an edge.