A Probabilistic Look at The Presidential Election: 04 November 2024

The Finish Line.

Here we are at Election Day. It’s been a long road. At some point along the way I thought I’d be doing one of these every night as the election got close. Unfortunately, that ran straight into my need to make a living. But here’s one final probabilistic analysis as the campaign draws to a close.

The Traditional Version

Let’s remind ourselves how these work. I took data for electoral-vote.com either averaging the polls from the last fifteen days or taking the single latest poll if there are no polls in the last 15 days.

We ran 40,000 simulated elections and tallied the results. We ended up with almost 73% of victories going toward Kamala Harris. Running all the states it looks like Harris has at least a 70% chance of winning with less than a 30% probability. I’ve talked about why that is likely an overestimate of Harris’s chances.

That’s why we started running a second simulation.

In our swings-only projection we give every state that is not a swing state to either the Democratic or Republican candidate. That means Harris starts at 226 electoral votes and Trump builds from 213. That’s a slight advantage for Harris.

These simulations give us a 59% probability of a Kamala Harris victory and about a 40% chance of winning for Donald Trump. That’s close but not so close as projected by other sites. It’s going to be a long night but Harris has an edge.

A Probabilistic Look at The Presidential Election: 30 September 2024

Catching up.

Having a day job can be a drag, I promised myself that I would keep up with these but, as usually happens that intention was trampled by the sheer amount of work generated by the college and my classes. If I publish these as much as I’d like as the election draws nearer, most updates will need to look more like this.

Any commentary I would offer would be stale, but here is the map (in the featured image), the shifts, and the results for the 30 September Data.

You can get a better look at the featured image on the blog.

Shifts:

Results

It’s reasonable to characterize this as roughly 3 to 1 in Harris’s favor.

An Electoral Map showing results from our 30 September 2024 data.

Last Words

These probabilities are still mostly driven by Harris’s advantage in the Dark Blue vs. Dark Red categories. Florida and Oregon are also probably shifting back and forth more than is reasonable.

A Probabilistic Look at The Presidential Election: 22 September 2024

Consolidations and a bit of a Debate Bump

Let’s get right to it. This is the first time since 14 August that one of the candidates had led in a victorious number of electoral votes.

The State of the Race

It’s been another crazy week.

It turns out that the happening at Trump’s golf course in West Palm Beach wasn’t random passersby engaging in gunplay. There was someone with an AK-47 at the edge of the golf course as Trump approached the fifth hole. The only gunfire though came from the Secret Service. The perpetrator was quickly apprehended. This is certainly an incident, but lots of folks are stopping short of calling it an “assassination attempt.”

Most of the polls this week have been very helpful for Vice President Harris. In fact, of the 12 polls that showed up on electoral-vote.com on Thursday, Donald Trump only led in one. There was a tied result in Pennsylvania, and the rest favored Harris. We could be seeing a debate bump finally taking hold.

In light of this, we notice that there has been a spate of anti-democratic stories this week. The Georgia elections board has mandated that ballot be counted by hand. That will grind the process to a halt and create chaos. In Ohio, the Secretary of State has written a very misleading description of an anti-gerrymandering amendment that will be up for a vote. And Senator Lindsay Graham has gone to Nebraska in hopes of convincing their legislature to switch the way, they allocate electoral votes to a winner-take-all system. Part of running a free and fair election involves not changing the rules late in the game, making this Nebraska thing seem like dirty pool. There’s more that I’ll leave you to hunt down.

Results:

As always we ran 40,000 simulations of the election as though it were being held today based on this week’s polling data from electoral-vote.com. Harris won 75% of these simulations, Trump won 24% and the remaining 1% were tied. In other words, it looks like the odds of Harris winning the election are at 3 to 1.

You can understand why Lindsay Graham went to Nebraska. If this map is correct, even if Donald Trump were to win every state marked as a tossup Harris would win 270 to 268. Changing how Nebraska allocates its electoral votes turns it into a 269 to 269 tie.

Probably not though because Harris is slightly ahead in Nevada and North Carolina. If we add in how the tossup states lean, this becomes a victory for Harris 292 to 246 EV.

That’s not a great way of looking at it though because in addition to the tossup states, the light blue and light red states are all close to or inside the margin of error. That excludes Oregon. We only have one poll from Oregon and it’s not as light blue as it seems.

The optimum way of looking at this might be Harris: 226, Trump: 189. Harris’s 3 to 1 odds notwithstanding this could still go either way.

Trends:

Digging in state-by-state, we can see that the bulk of the shifts this week are good news for Vice-President Harris. Let’s start with the states that have a redshift.

Like Colorado and Arkansas last week, the shift in Indiana doesn’t tell us anything that we didn’t already know. Last week’s result was based on one that was months old and just didn’t capture how red Indiana really is.

The shift in Maine’s second district is a big one, but it puts the Maine 2nd more or less back where it had been before the previous poll. That’s not really a surprise. Because of the change in the Maine 2nd, Maine as a whole seems a little less blue. Virginia’s shift is a small one right at the borderline between those two categories.

Looking at these states with a blue shift the one non-story here is Pennsylvania. That’s just a happy little dance within the margin of error.

Iowa though was a surprise. Donald Trump had an 18 point lead that shrunk to meager four points. The race in Florida, meanwhile has looked like it’s been tightening for a while. Perhaps it really is.

New Hampshire, New Mexico, and Rhode Island all could be the same story as Indiana. All of the states though have been polled multiple times; New Hampshire and New Mexico were looking downright swingy for a while. If these three are legitimately safely blue that frees up some resources that could be better used in, to pick a couple of states at random, Iowa and Florida.

Last Words

As much as I would rather continue to pontificate here, there is unfortunately other work I need to get to. We’ll check in again next week and see if these trends continue.

A Probabilistic Look at The Presidential Election: 14 September 2024

Drifting Towards Harris

This is my first update on my new schedule. I downloaded the data from ElectoralVote.com yesterday, the 14th, at around noon and I’m processing it today on Sunday. With luck, I’ll have this out tonight.

The State of the Race

It’s been a bizarre 10 days! Monday seems like a lifetime ago. It was on Monday when I clicked on a “Cats for Trump” hashtag on Twitter or whatever the hell it’s called now. It struck me as pitiful. It seemed like Trump’s people were out of ideas and were trying anything to move the needle or slow Harris’s momentum.

Tuesday was the debate. It was a solid and clean win for Harris. We got the Trump we saw in the first debate and his furious firehose of falsehoods. That should have been disqualifying then, but we and the media were too busy realizing that President Biden is an octogenarian. In the second round, we got more of the same from Donald Trump with the added bonus that Kamala Harris was really able to piss him off. That led to some crazy, incoherent rants. It turns out it’s pretty easy to push that guy’s buttons as Vladimir Putin and a bunch of others figured out long ago. The only people I saw arguing that Donald Trump won the debate were on right-wing websites where they probably didn’t have the option of saying anything else.

Unfortunately, there are so few undecided voters at this point that the debate didn’t move the needle immediately. As things get played over and over over on the teevee machine some stuff will reach critical mass and start to sink in. A debate bump does not need to be instantaneous.

Oh. Also, the debate and a crudely made AI likeness inspired Taylor Swift to finally endorse Kamala Harris. Trump responded by saying that he hates her while making a knockoff of one of her concert T-shirts. This will eventually be hilarious, but not for Trump.

The latest news is that there was gunfire this afternoon near Trump’s golf course in West Palm Beach. I knew that neighborhood or did 20 years ago. It’s fine, but gunfire isn’t all that surprising. The Trump campaign tried to color this as a second assassination attempt. I guess we’ll see.

Results:

We ran our usual 40,000 simulations of the election. If the election were today it looks like Harris would win about seven out of 10 times. Trump’s chances are close to three out of 10 and as usual we’re seeing about one percent of the results turn out to be ties.

An Electoral Map showing projected results based on the 14 September 2024 Data.

That seems to track. Harris’s collection of “safe” votes is growing and is nearly twice as large as Trump’s. That’s a big driver of the probability. Make no mistake, there are enough toss-up votes that this thing could go either way.

Trends:

We can go back to tracking the individual changes because we’re on our second week of taking polls back 15 days. We have apples-to-apples comparisons. I’ve split the shifts into the moves toward the left and the moves toward the right.

Colorado and Arkansas don’t really show us any recent changes. Those states have probably been in the strong columns for months. It’s just that they haven’t been polled in a long time. We’ll see the same thing when we finally get new polls from Oregon and Indiana.

Michigan and Wisconsin don’t tell us too much either. These are small shifts on the edges of the categories. Light blue, light red, and taupe are all mostly inside the margin of error.

Virginia and Ohio on the other hand are pretty big shifts and are mostly in Harris’s direction. Ohio doesn’t look likely to turn blue, but if it shifts into a place where it’s competitive and Virginia settles into being safely blue that could inspire a potentially game-changing shift of resources.

Last Words

Kamala Harris having a seven out of 10 chance of winning the election if it were held today seems pretty reasonable at this point. Nate Silver this week has those probabilities almost exactly backward, with Trump having about a seven out of 10 chance of winning. On the other hand, I spent some time this afternoon listening to Christopher Bouzy on Spoutible, revealing his new electoral map. That one seems wildly optimistic in Harris’s direction.

But both of those guys are trying, something more robust than a polls-only estimate. They’re trying to factor in other information, which is more subjective. That might explain why these two projections differ so strongly. The two approaches should theoretically converge as we get closer to election day. In the meantime, I should take a dive into their reasoning to see if I can assess it. Right now I’m comfortable being in the middle.

A Probabilistic Look at The Presidential Election: 04 September 2024

Stubbornly Stable.

Yeah, it’s taken me a while to get this one out, again. Sorry. It’s been tricky settling back into the academic year.

Starting this week I will download polling data on Fridays and, with luck, will have a post for you on Saturday. Look for our next update on or around the 14th.

That thing about a week being an eternity in politics has never seemed more true. Donald Trump’s visit to Arlington National Cemetery was a bit more than a week ago, but that’s still within the data collection for this update. It’s been a crazy week or so.

The State of the Race

One thing that surprised me was Nate Silver’s announcement on Thursday that according to his model, Donald Trump had about a 60% chance of winning the election. Silver is doing something fundamentally different than I’m doing here. He’s trying to bring fundamentals and other factors into his probabilities while I’m just looking at poll numbers.

I just do not see it. And whereas good poll numbers are based in fact, I worry that trying to factor in other fundamentals doesn’t. A lot of it, I believe, is guesswork at best and wishful thinking (or existential terror) at worst.

Let’s look at what happened over the past few days over at electoral-vote.com. On Thursday Pennsylvania shifted from barely Democratic to toss-up. Friday’s map had Pennsylvania back at barely Democratic, while Georgia moved from barely Democratic to toss-up and North Carolina moved from barely Republican to toss-up. Yesterday, Texas moved from leans Republican to barely Republican. That sounds like a big deal until you dig into the data. In this case, the margin shrank from five points to four. It is, to paraphrase the Bard, much ado about very little. The website 270 to Win moved Texas and Florida from red to toss-up on Friday. Here’s their “Polls Only” Map.

If this is correct there’s a lot of open ground where either side can grow. Are Trump’s chances of victory improving? That’s harder to say.

Results:

I was pondering a change in methodology last week. I’m only making one change. I’m now reaching back 15 days to gather my polls rather than 10. Some of the polls on Electoral-Vote.com collect data for a month. Since the date on EV’s polls is the midpoint of the data collection, those would never get included with any window shorter than 15 days.

This will also keep more polls in the data set and reduce the chance that one extreme or outlier poll will skew the data.

As usual, we entered the polling data into our model and ran 40,000 simulated elections. Here’s what we get.

More states are showing as “Toss Up” than our recent updates, but light red, light blue, and taupe are very close together; this is not a dramatic change.

The results of the simulations tell us that the probability of Harris winning if the election were held today sits at 60% while Trump’s likelihood of victory is about 39%. One percent of the simulations ate ties.

This is where our results have been for a while, Harris still has a slight lead and the odds of her winning remain at about 3 to 2. But wait.

Trends:

I shifted methods so I’m not going to list the week-to-week changes. In the Electoral-Vote.com data, there’s some slight tightening in the race as evidenced by the larger number of toss-up states. Since I collected this data there was Nate Silver’s election probability, Trump’s pulled ahead on at least one betting site and Trump led the latest NYTimes/Siena College poll. Contrarily Harris is ahead in the FiveThirtyEight analysis with a 54% chance of victory.

We might be looking at a 50/50 race in out next update, but from our vantage point, the race as a whole seems stubbornly stable. In our model Harris’s advantage is driven by how many more electoral votes remain in the “Strongly Democratic” column vs. it’s “Strongly Republican” counterpart. Want to move our numbers? Get us a fresh poll in Indiana or Oregon depending on which side you’d like to help.

Last Words

I looked at something a little different this week and it’s interesting. While most of our analysis seems centered on the close races, let’s look at the ends of the red/blue spectrum. I ran a set of 1000 simulations and looked at the biggest landslides. The best result for the Republicans was a victory of 353 EVs to 185. The biggest win for the Democrats was 398 to 140. The maps for these might look something like this.

Neither of these are are going to happen; we won’t get close to either without a systematic polling error. Still, these look a lot more reasonable in the light of 270-to-Win’s polls only map; if you assume all the Toss Ups fall in one direction you get a Democratic victory of 390 to 148 or a Republican victory of 328 to 210. Stay tuned.

A Probabilistic Look at The Presidential Election: 28 August 2024

No DNC Bump & Dancing Inside the Margins

Quicker than usual; I have to be ready to Teach on Monday. There are actually two sets of results here. I’ll explain.

Results for 28 August 2024:

The projected electoral map between Harris and Trump based on the 28 August data.

As usual, we collected data on Wednesday. We’re in virtually the same place as we were last week. Here Harris wins about 62% of the simulations and Trump takes about 37%. The likelihood of a tie is still at about 1%. Let’s look at the state shifts.

StateChange
ArizonaBarely Democratic to Barely Republican
Maine ALLeaning Democratic to Strongly Democratic
Maine 2ndBarely Republican to Leaning Democratic
North CarolinaBarely Democratic to Toss Up
WisconsinToss Up to Leaning Democratic

There is more dancing of the results that live inside the margin of error. The Maine shifts are the most significant here and that’s why the probability barely moved even though Trump pulled ahead with the electoral count. The light blue, light red, and tan states all have probabilities at or near 50/50; those will bounce back and forth in the simulations but the dark blue and the dark red? Those stay on one side for the majority of the trials. If something moves into one of those categories we’re likely to see it.

So, we’re holding steady with the odds of a Harris victory sitting at 3 to 2; there’s no real evidence of a bump from the Democratic convention. Globally the numbers still seem to be trending in Harris’s direction.

Results for 29 August 2024:

Several polls that showed a movement towards Harris in the swing states arrived on 29 August. Here are the results from that next day. I won’t give these results their own write-up because I played with the parameters; there are no apples-to-apples comparisons.

Last Words

These results are making me think about my methodology; I’d like to tamp down the variance and I’m not sure the colors are giving the best indication of the state of the race. Still, I don’t want to switch things up too many times.

So, I’m pondering. I may just let the status quo ride and make changes for 2028. If I make more alterations I’ll use them until Election Day. My plan is to have everything sorted by Wednesday.

A Probabilistic Look at The Presidential Election: 21 August 2024

This is what the stock market calls a “correction.” Harris Still Favored

I’m watching night 3 of the Democratic National Convention and Oprah just exited the stage. It was electric; the crowd was as energized as it has been all through the convention. Today we’re looking at a set of data that was collected almost entirely before the convention.

The State of the Race

The slowdown in the campaigning is over and the DNC seems to be sucking up all the air in the election. Well, maybe it’s just sucking up all of my attention. (Boy, that was just a hell of a response for Mayor Pete.) The excitement in the Arena is palpable and infectious. There was little to no bounce coming out of the RNC. I don’t think the same will be true of the DNC.

Trump and Vance are on the campaign trail, and Trump seems more active than last week, but I don’t know if it’s enough. More on that after the analysis.

Results:

A minor change in the methodology; with this update, I’ve separated out the congressional districts in Maine and Nebraska. Those are modeled separately and this will make the projections a bit more accurate. Since Electoral-Vote.com doesn’t have that data I’ll be taking it from Projects.FiveThirtyEight.com. Plus the first and third districts in Nebraska needed a smidgen of algebra because I only had separate polling on District 2. Aside from that, as always, an explanation of how the map was created and our scheme for finding our polling averages can be found here: Methodology.

You probably know how this goes by now. We entered the polling data into our model and ran 40,000 simulated elections. If the election were held today, Vice President Harris would have roughly a 62% chance of winning while Donald Trump would win about 37% of the time. The likelihood of an Electoral College tie is still approximately 1%.

This is a “polls only” approximation and so it’s sensitive to changes in polling numbers. That leads to some volatility. For example, let’s look at Virginia which moved from “Leaning Democratic” to “Barely Democratic.” Here’s what that looks like in their data.

From electoral-vote.com: a graph of presidential polling in Virginia.

That is not a dramatic change, we’re looking mostly at the result normal of statistical variation.

Given this data, Harris still leads and the odds of her winning the election are about 3 to 2.

Trends:

The averages have shifted back in Trump’s direction and it’s put the odds for Harris and Trump back to where they were two weeks ago. Here are the changes from last week.

StateChange
GeorgiaToss Up to Leaning Democratic
MichiganBarely Democratic to Toss Up
NevadaBarely Democratic to Barely Republican
North CarolinaToss Up to Barely Democratic
PennsylvaniaLeaning Democratic to Toss Up
VirginiaLeaning Democratic to Barely Democratic

As I mentioned above most of these look like what happens with results within the margin of error. The possible exception there is Georgia where the new poll looks a lot different from the previous one. My best guess is that this is merely a more accurate description of the state of the race than a rightward shift but it could be either. More polling will determine that. It turns out that one consequence of my choice of using a ten-day window for poll numbers is some volatility as we’re frequently replacing a single poll with a different single poll. I hope we get more state polls as election day draws closer; that will tamp down the variation.

The odds of a Harris winning sitting at 3 to 2 seems more reasonable than the 3 to 1 we found last week.

Last Words

I’m now writing on Thursday Morning. The end of Night 3 at the DNC was nearly flawless. Walz gave a powerful “pep talk” that received what might have been the best crowd response of the day. It was also steeped in Americana. A high school football coach who loves his family, helps his neighbors, and helped win a state championship surely has appeal to voters all across the political spectrum. And watching his family was heart-warming. Trying to reconcile that with a “soulless communist who will destroy America” just does not compute.

Neil Young’s “Keep on Rocking in the Free World” is a perfect song to end the evening.

As I mentioned, I haven’t seen much coverage of the Republican campaign. I’ve seen a tiny rally featuring Vance, part of a small, weird, appearance by Trump in Howell, Michigan, and an AI-generated image implying that Taylor Swift is endorsing Trump. In addition, a Trump staffer released a now-deleted video of Trump backed by Beyoncé’s song “Freedom,” Trump had claimed that he is better looking than Kamala Harris and that there’s no way Harris’s acceptance speech will get better ratings than his speech to the RNC. Trump’s interest in crowd sizes remains an ongoing theme. Maybe I’ve seen more than I thought.

Let’s take those one at a time.

  • The Vance rally just seems like more of the same.
  • In his appearance in Howell, Michigan Trump seemed lethargic. If any other candidate had made that speech Trump would have been all over them for being “low energy.” Also, “Kamala crime wave?” Seriously?
  • I’m pretty sure the Taylor Swift thing was a misstep.
  • I’m certain using Beyoncé’s “Freedom” was a misstep. There’s already a cease and desist order. A lawsuit will probably follow.
  • “I’m better looking than Kamala Harris” is just sad.
  • And bragging about the ratings of his acceptance speech is just dumb. There will be objective evidence tomorrow and my money here is on the new kid. If Trump’s right this is a non-story. If he’s wrong it’s an embarrassment. There’s no upside.
  • Trump’s obsession with crowd sizes is getting funny. The best example of that is probably Walz and Harris appearing remotely to the DNC after the roll call vote from the very same venue that hosted the RNC. Both venues were packed and there was no footage of anyone leaving early. If nothing else this was some world-class trolling.

Trump had a pretty effective line of attack against President Biden, but it’s now been a month since the president dropped out. The Trump Campaign still does not have a coherent strategy to run against Harris. Falsely calling her a communist or blaming her for a nonexistent crime wave might play to his base but it won’t play with independents and it won’t bring any new voters to his cause. We’ve seen it all before.

A Probabilistic Look at The Presidential Election: 14 August 2024

Harris’s Momentum Continues

Let’s GO!

The State of the Race

The campaign seems to have slowed down somewhat while the Democrats gear up for their convention. Vice President Harris and President Biden will appear together today (8/15) in Maryland while Governor Walz is on his own tour of the Northeast. JD Vance is in Pennsylvania today while yet another controversial quote has surfaced.

Donald Trump has been a bit more active than he had been. This week we’ve seen his interview with Elon Musk on X and a last-minute rally in North Carolina which was supposed to be focused on the economy. The economic content was sparse while Trump frequently veered off-topic and attacked his opponents.

Results:

An explanation of how the map was created and our scheme for finding our polling averages and can be found here: Methodology.

As usual, we entered the polling data into our model and ran 40,000 simulated elections. If the election were held today, it appears Vice President Harris would have about a 74% chance of winning while Donald Trump would win about 25% of the time. The likelyhood of an Electoral College tie is roughly 1%.

Remember that this is an estimate and it is only based on the current polling numbers. As we’ve seen these can change dramatically over three weeks; and we’re nearly three months from the election.

Given this data, Harris leads and the odds of her winning could be as high as 3 to 1.

Trends:

The race continues to move in Harris’s direction. This is evident if we look at the movements of the state polls between last week and this. There’s one exception to the trend;

Michigan changed from Strongly Democratic to Barely Democratic. This was expected; the polling average last week was based on a single poll that was a clear outlier. That poll, which had Harris up by ten fell out of the average was replaced by two more typical results.

The other shifts tell a consistent story.

  • Texas: Strongly Republican to Leans Republican
  • North Carolina: Barely Republican to Toss Up
  • Arizona: Barely Republican to Barely Democratic
  • Pennsylvania: Toss Up to Leans Democratic

These all show movement toward Harris. In addition, within the last week, Harris is now leading:

  • in national popular vote polls and polling averages,
  • in states with a total of more than 270 electoral votes,
  • on forecasting sites like 538 and The Cook Political Report, and
  • on betting sites like Polymarket.

The comparative attendance and enthusiasm at Democratic vs. Republican Rallies also speak in Harris’s favor.

The momentum remains on Harris’s side.

Last Words

The Harris campaign has consolidated its lead over the last week. It’s no surprise; just over three weeks ago most voters believed that the presumptive nominees of both major political parties were too old to effectively serve as president. The voters wanted a new candidate in the race. With President Biden’s decision to withdraw his candidacy, they got one. The political landscape shifted and the Democrats are capitalizing on that by running an effective, aggressive, and positive campaign. Likely, they will further strengthen their position throughout their convention. But conventional wisdom would then suggest that things will shift back toward being competitive as the campaign begins in earnest and Harris and Walz have to add some specifics to their policy proposals.

But maybe not.

Donald Trump spent months attacking President Biden and implying he should withdraw from the race. He should have been prepared when it happened. But he wasn’t.

At the RNC, with the possibility of Biden’s withdrawal growing more likely, Trump could have picked a running mate that could bring more voters into their base. But he didn’t.

In the aftermath of an assassination attempt, Trump could have changed tactics, eschewed political violence, and become a candidate aiming to unite the nation. But he couldn’t.

Trump could have gone on the campaign trail to court voters and make the case for the Republican ticket every day since 21 July. But he wouldn’t.

Instead, he picked a running mate who appealed to the extreme edge of his base and who is alienating voters, childless cat ladies, and post-menopausal females.

And he didn’t turn away from political violence. When he mentioned Paul Pelosi at the RNC he pantomimed a hammer. “Bam, bam, bam!”

And there’s nothing new in his rhetoric. He hasn’t even bothered to change his talking points. the “Worst President in American History,” became the “Worst Vice President” and “Lyin’ Joe Biden” has turned into “Lyin’ Kamala Harris.” Simplistic.

And the lies are all the same no matter what Trump wants to tell us. The 2020 Election wasn’t stolen. Trump didn’t have the biggest inaugural crowd ever. He wasn’t the best President for African Americans since Abraham Lincoln. We are actually better off than we were four years ago. The list goes on.

This election could still go either way, but it’s getting close to the point where it will take something as dramatic as a major party candidate withdrawing from the election for that to happen. But it’s getting late to try that; ballots are closing.

If Donald Trump doesn’t get back on the campaign trail and give the country something more than the same old grievances, the same old falsehoods, and the same old show this election could be a rout. We’re tired of it.

A Probabilistic Look at The Presidential Election: 8 August 2024

Harris Takes Lead

Hello again!

The State of the Race

Since our last update, the Democratic Ticket has been campaigning across the country working to extend their momentum from the past two weeks. The big news there is the unveiling of Tim Walz as Harris’s running mate. They’ve been touring the swing states since the announcement and drawing large enthusiastic crowds.

JD Vance has been following them across the country trying to draw comparisons between the two campaigns. It’s been lackluster. The comparison is not helping the Republicans.

Meanwhile, Donald Trump has been mostly absent from the campaign trail; with only one sparsely attended rally in Montana and a press conference. I haven’t watched the press conference yet so I’ll reserve comments for now. The Trump Campaign holding a rally in Montana is mystifying. That’s a move you make when you’re on a clear path to victory and you can afford to spend resources on a Senate seat. His campaign has bigger issues. Was it about trying to get a rally with good attendance for a visual to counter those coming out of the Harris campaign? A positive event to get Trump back on the trail?

The narrative around the debates is mystifying as well. Trump began making up a possible debate on Fox News even before he debated President Biden. But the waffling, then canceling the debate, then insisting on the made-up Fox News debate, and finally canceling again all made Trump look frightened. Making up another debate and then insisting on three debates is a weird thing to do and is too little, too late.

The Harris/Walz tour of the swing states wraps up Saturday in Nevada.

Results:

Once again we entered the polling data into our model and ran 40,000 simulated elections. If the election were held today, it looks like Donald Trump would have about a 35% chance of winning with Vice President Harris winning about 64% of the time. The remaining 1% were Electoral College ties.

Again, I would emphasize that this is an estimate. There weren’t many state polls in the last week and using our scheme had an interesting effect: it turned out that every state ‘average’ was determined by a single poll.

This had its greatest effect in Michigan as the one poll used there is probably an outlier (Harris led by 11), which would make the probability of a Harris victory an overestimate.

Given this data, Harris is in the lead and the odds of her winning the election could be as good as 3 to 2.

Our scheme for finding our polling averages and creating the map can be found here: Methodology.

Trends:

Trump was favored to win in our 21 July probability, and Harris pulled roughly even with him in our 31 July estimate. Now, for the moment, it’s safe to say that Harris has an edge. Strictly looking at the probabilities generated from the models, Harris’s probability of winning the election is roughly where Trump’s was on 21 July, between 63 and 64%. This is a complete turnaround in just under three weeks.

But that’s not the only evidence. Other predictive sites are showing similar results. Nate Silver now has Harris favored to win both the popular vote and the Electoral College. The New York Times/Siena College Poll released this morning has Harris leading Trump by 4 points in Wisconsin, Pennsylvania, and Michigan. The Cook Political Report has reclassified the race in Arizona, Georgia, and Nevada from “Lean Republican” to “Toss Up.”

The momentum remains on Harris’s side.

Last Words

It’s beginning to look like the campaign is the Democrats’ to lose. They have been able to dominate the news cycle and generate enthusiasm since the Republican Convention with President Biden’s withdrawal, followed by Harris introducing herself, the party unifying behind her, and then the announcement of Walz as Harris’s running mate. This could easily continue as the Democratic Convention will lead to hearings about Trump’s January 6th Election Interference Case which will bring us into early voting.

The Trump Campaign still seems unable to find its footing. They continue to throw whatever they can against the Democrats but nothing yet has really stuck outside of their MAGA base. With Vance drawing tiny crowds and Trump largely off the campaign trail it’s hard to see how they can turn this around. Right now it’s easy to find headlines like “Trump Campaign Bleeding Support…” or “Is Trump ‘Losing His Marbles.’

Still, this election could go either way. Even if the probability of Trump winning the election is really at 35% (and many sites have it higher) that’s still about 10% better than his chances of winning the 2016 election. In that election, he exceeded expectations at every turn. While the Republican Party’s overconfidence in July is partly responsible for the current state of the election other overconfidence could still shake things up dramatically.

A Probabilistic Look at The Presidential Election: 31 July 2024

Harris Has the Momentum

Hello! Thanks for joining me!

I’ve been publishing election projections for a few years now and I’ve been meaning to start publishing projections for 2024. With the big shake-up in the race, this seemed the ideal time to start.

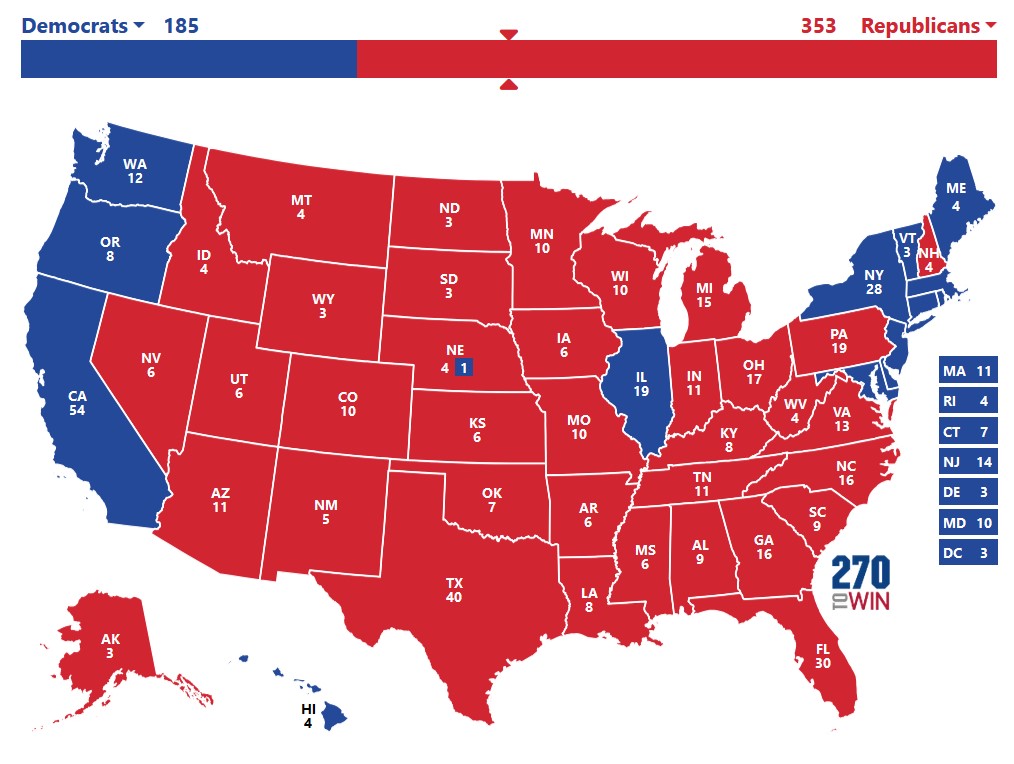
This will actually be my second projection for this election. I did the first for my appearance on WETM’s Political Pundit Night on 9 May. At that point, Donald Trump would have had about a 66% chance of winning the election had it been held on that day.

But let’s get down to brass tacks as they say.

The State of the Race

It’s been a tumultuous few weeks after the race had been pretty stable for quite a long time. Of course, the tremors started with the first debate. You can read my analysis of that here. What’s the bottom line? President Biden gambled that a strong debate performance would shake things up and allow him to go on the offensive. That was not at all what happened.

At the debate, President Biden, coming off an exhausting travel schedule and with a cold, seemed feeble. Still, he mostly made sense. Trump, in contrast, spewed a torrent of falsehoods. His voice however sounded confident and assertive. The narrative coming out of the debate was heavily skewed toward the candidates’ presentation rather than the content of their answers. Calls began for Biden to withdraw from the ticket and that received the lion’s share of the media’s attention. Trump’s lies deserved equal attention.

The Trump campaign was uncharacteristically disciplined as the Democrats tried to regain their footing after the debate. By the time their convention rolled around the GOP thought they were riding a wave of inevitability to certain victory. This only intensified after the assassination attempt. They pandered to the fringe of their party by picking the problematic J. D. Vance as their vice-presidential candidate and some Republicans over-reached by trying to blame the assassination attempt on democratic rhetoric. None of that, amazingly, moved the needle very much.

That all changed when President Biden stepped aside and, as he put it, passed the torch onto a new generation by endorsing Vice President Harris. Over the last ten days, the Democrats have achieved a level of enthusiasm they have not reached in quite some time.
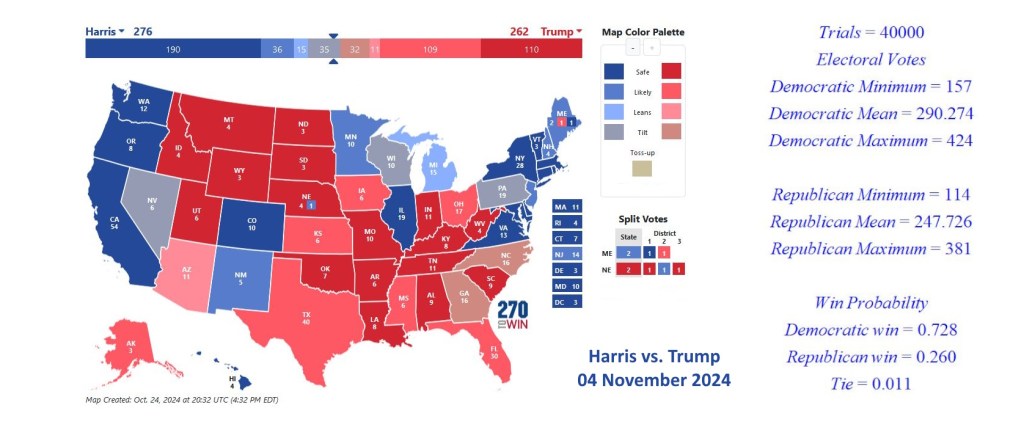
Results:

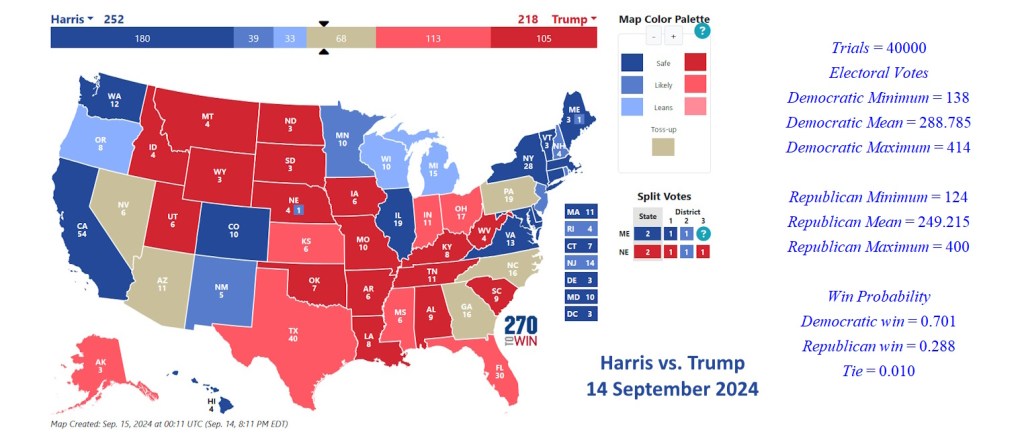
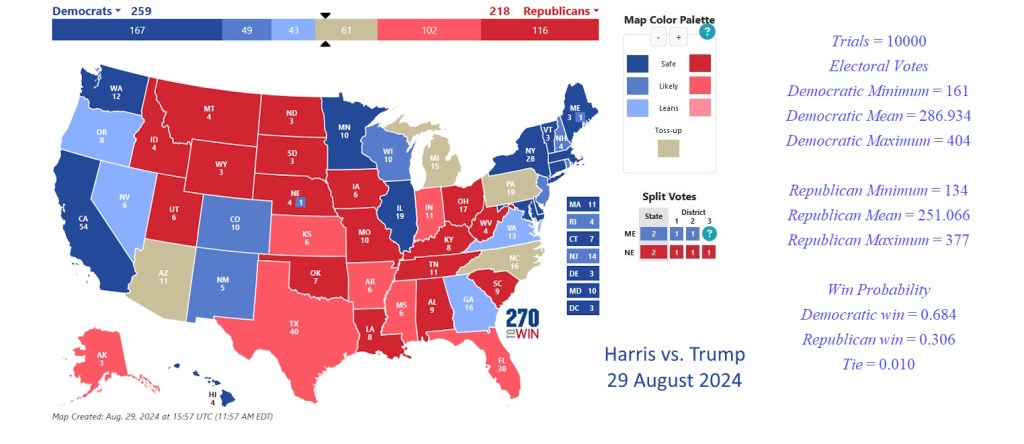
After entering the polling data into our model and running 40,000 simulated elections it appears that if the election were held today, Former President Trump would have about a 45% chance of winning. In contrast, Vice President Harris would win with a probability of 54%. The remaining results were electoral college ties.

An estimated electoral map for the US Presidential Election as of 31 July 2024.

I wouldn’t put too much faith in the units’s digit in those probabilities. Indiana, for example, landed in the “leaning Republican” category because of a single poll that was taken back in April. If it were in the “strongly Republican” category the probability of a republican victory would be somewhat but not dramatically better.

The bottom line is that this is now a competitive race with the two major candidates having about equal odds of victory.

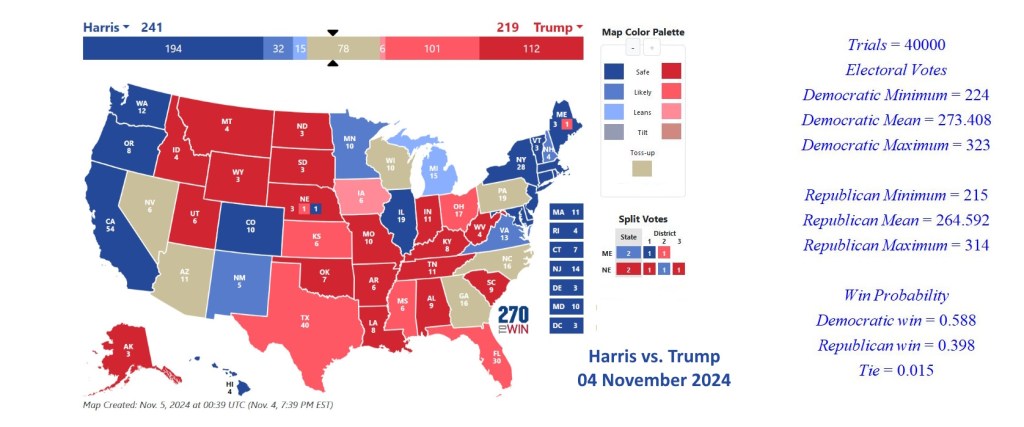
Trends: What a Difference 10 Days Make

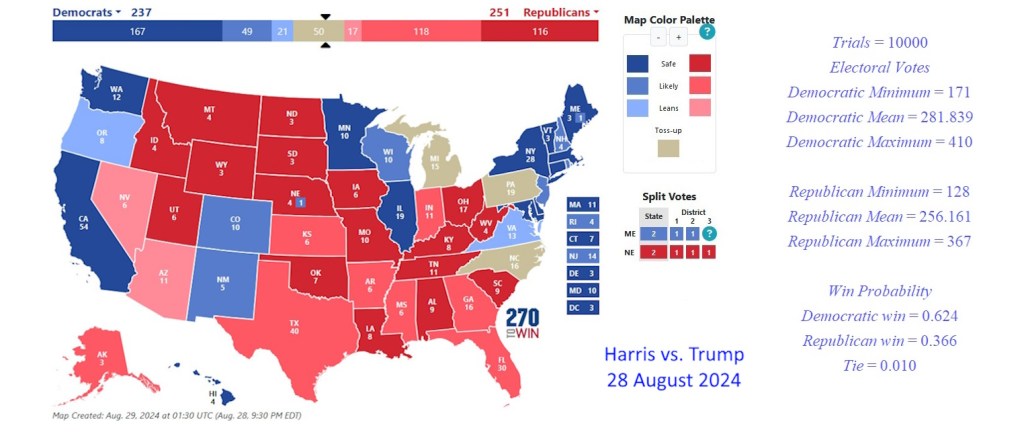
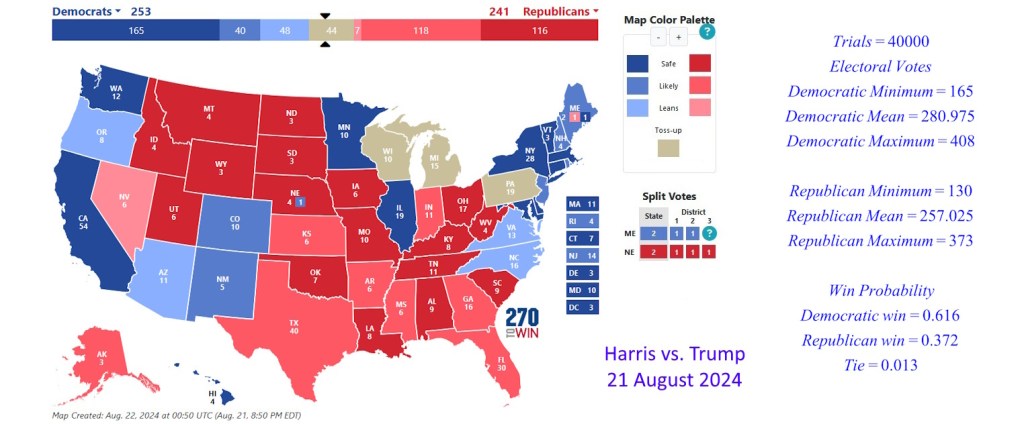
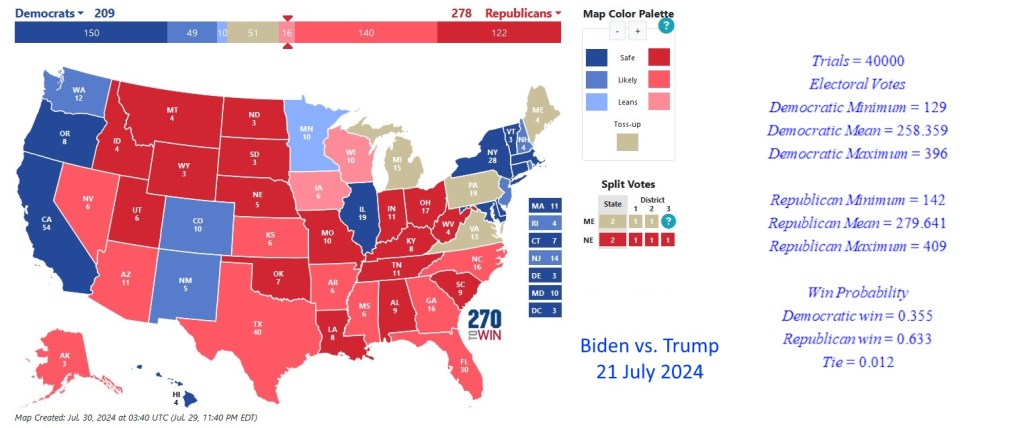
To get an idea of how the race is changing, let’s look at where the race was on 21 July, the day President Biden ended his candidacy.

An estimated electoral map for the US Presidential Election as of 21 July 2024.

At this point, Trump had about a 63% chance of winning the election. This was down a bit from the 8 May projection mainly because on 21 July despite the setbacks on the democratic side there were more states in the “Strongly Democratic” category and fewer that were “Strongly Republican.” This is mainly due to minor changes in my methodology for processing the polling data.

The best way to parse this is that the probability of a Trump victory fell from about 2/3 to roughly 1/2. This is a significant change in favor of Vice President Harris and at this moment the momentum is clearly on her side. This might settle down at this level in which case we would be looking at a close election. There are plenty of reasons to think that the momentum in Harris’s direction will continue for a while. Her pick for Vice President is imminent and the Democratic Convention follows quickly. The Republican Convention had little effect on the state of the race but we’ve known Donald Trump for years now. Harris though is still introducing herself and the data here indicates that voters like what they’ve seen so far. The Democratic Convention could move the needle dramatically as people get to know her and her Vice Presidential pick.

Methodology

The Polling Averages:

I took polling data from Electoral-Vote.com which avoids using partisan polls.

For the July 31st estimate: I took the mean of all the polls released after 21 July to get each state’s polling average. If a state had no polls after 21 July the most recent poll was used.

The July 21st polling averages were determined by taking the mean of the four most recent state polls or the mean of all the state polls after 1 April if there were fewer than four.

The polling averages were fed into a US Presidential Election Calculator; an earlier version of which can be found at MapleSoft Application Center.

The calculator runs a large number of simulated elections. The probability of each candidate winning is estimated by the percentage of the simulations won by each candidate.

The Map:

The colors on the map are determined by The polling estimate rather than by the probability that a candidate will win a state. 

In each state, we use the polling estimate to find the conditional probability that an individual voter would choose either the Democrat or the Republican assuming they are voting for one of the major party candidates. Thus, to find, for example, the probability that a voter would choose the Democratic candidate, assuming they are voting for a major party nominee, we would calculate the following.

The formula for the probability that a voter would choose the democratic candidate given they are voting of a major party candidate.

The colors on the map are determined as follows:

  • Solidly Democratic (Dark Blue)         100%  > P(D|D or R) > 55%
  • Leaning Democratic (Light Blue)         55% > P(D|D or R) >   52%
  • Weakly Democratic (Pale Blue)         52% > P(D|D or R) >   51%
  • Toss-Up (Gray)                                     51%  > P(D|D or R) >   49%
  • Barely Republican (Light Red)          51%  < P(R|D or R)  <   52%
  • Leaning Republican (Light Red)          52%  < P(R|D or R)  <   55%
  • Solidly Republican (Dark Red)          55%  < P(R|D or R) < 100%

If a candidate is polling at 55%, the probability that he or she will win the state is actually quite a bit better than that.

For future installments, we’ll move this technical information to its own page and establish a consistent policy for creating state polling averages going forward.

Last Words

Although the Trump Campaign was smart to keep quiet as the Democrats argued over whether President Biden should withdraw from the race their response to having Harris at the top of the ticket has ranged from befuddled to panicky to weird. I didn’t expect that. It seemed to me the smart move would have been for Trump to declare victory. Something along the lines of “I’ve already beaten Joe Biden! He knew he was going to lose and he was too scared to stay in the race! I’ll beat the Democrats’ second choice just as easily.” That wouldn’t have been true but it’s a position of strength that would have been more effective than what we’re watching.

Waffling on the second debate was an unforced error. That’s a position of weakness that the Harris Campaign has been able to exploit. What would have been better? “Of course, I’ll debate Kamala. And you know what? I debated Biden and he was forced out of the race… who’s their next candidate going to be after I force her out of the race too?” This would take guts because if Harris wins that debate, and I think she will, it would be devastating. And there’s the rub. I believe that Trump is genuinely scared to debate her. Still, I’m happy to be wrong about Trump’s response to Biden’s withdrawal.

Where do we go from here? Trump and his campaign spent the Republican Convention trying to fire up their base. JD Vance was a choice intended to appeal to the right-wing fringe of the Republican Party. Vance isn’t going to bring any new voters to the Trump campaign but I suspect there are some Republicans who might feel motivated by his “childless cat-lady” comments.

With Harris at the top of the Democratic Ticket, the Trump Campaign needed to pivot and try to attract new voters. They should be walking back these comments. Instead, Vance doubled down on them.

And Donald Trump’s interview with the National Association of Black Journalists on Wednesday is more of the same. Trump was rude and belligerent. He attacked Harris for ‘changing her race’ whatever that means. We should, as a nation, collectively recoil from Trump’s remarks. Will we? This will not bring new voters to the Trump Campaign but Trump himself must think it will appeal to someone; he continued the racial attacks on Harris on Thursday. Even if we don’t recoil en masse, these remarks will repel most voters. If Trump doesn’t figure out how to run against Harris her momentum will continue and we’ll be looking at a landslide in November.