Catching up.
Having a day job can be a drag, I promised myself that I would keep up with these but, as usually happens that intention was trampled by the sheer amount of work generated by the college and my classes. If I publish these as much as I’d like as the election draws nearer, most updates will need to look more like this.
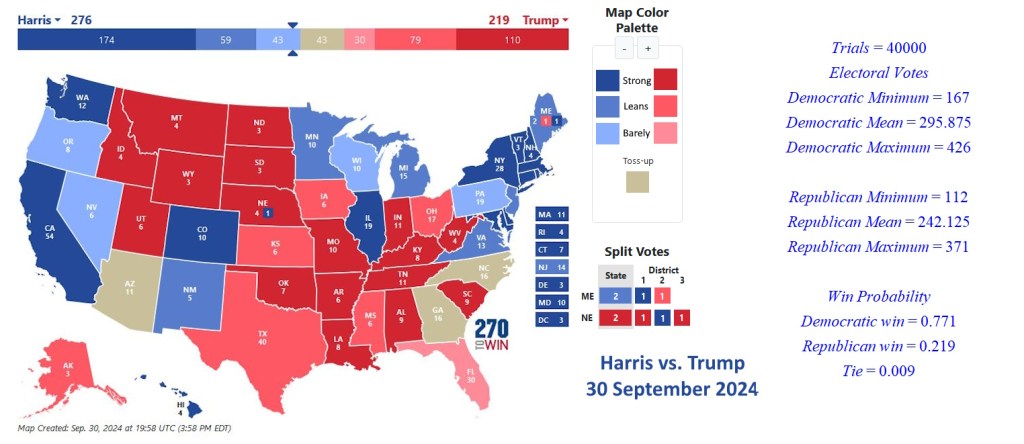
Any commentary I would offer would be stale, but here is the map (in the featured image), the shifts, and the results for the 30 September Data.
You can get a better look at the featured image on the blog.
Shifts:
| State | Change |
|---|---|
| New Mexico | Strongly Democratic to Leaning Democratic |
| State | Change |
|---|---|
| Nebraska 2nd | Leaning Democratic to Strongly Democratic |
| Michigan | Barely Democratic to Leaning Democratic |
| Nevada | Toss Up to Barely Democratic |
Results
It’s reasonable to characterize this as roughly 3 to 1 in Harris’s favor.
Last Words
These probabilities are still mostly driven by Harris’s advantage in the Dark Blue vs. Dark Red categories. Florida and Oregon are also probably shifting back and forth more than is reasonable.

