Stubbornly Stable.
Yeah, it’s taken me a while to get this one out, again. Sorry. It’s been tricky settling back into the academic year.
Starting this week I will download polling data on Fridays and, with luck, will have a post for you on Saturday. Look for our next update on or around the 14th.
That thing about a week being an eternity in politics has never seemed more true. Donald Trump’s visit to Arlington National Cemetery was a bit more than a week ago, but that’s still within the data collection for this update. It’s been a crazy week or so.
The State of the Race
One thing that surprised me was Nate Silver’s announcement on Thursday that according to his model, Donald Trump had about a 60% chance of winning the election. Silver is doing something fundamentally different than I’m doing here. He’s trying to bring fundamentals and other factors into his probabilities while I’m just looking at poll numbers.
I just do not see it. And whereas good poll numbers are based in fact, I worry that trying to factor in other fundamentals doesn’t. A lot of it, I believe, is guesswork at best and wishful thinking (or existential terror) at worst.
Let’s look at what happened over the past few days over at electoral-vote.com. On Thursday Pennsylvania shifted from barely Democratic to toss-up. Friday’s map had Pennsylvania back at barely Democratic, while Georgia moved from barely Democratic to toss-up and North Carolina moved from barely Republican to toss-up. Yesterday, Texas moved from leans Republican to barely Republican. That sounds like a big deal until you dig into the data. In this case, the margin shrank from five points to four. It is, to paraphrase the Bard, much ado about very little. The website 270 to Win moved Texas and Florida from red to toss-up on Friday. Here’s their “Polls Only” Map.

If this is correct there’s a lot of open ground where either side can grow. Are Trump’s chances of victory improving? That’s harder to say.
Results:
I was pondering a change in methodology last week. I’m only making one change. I’m now reaching back 15 days to gather my polls rather than 10. Some of the polls on Electoral-Vote.com collect data for a month. Since the date on EV’s polls is the midpoint of the data collection, those would never get included with any window shorter than 15 days.
This will also keep more polls in the data set and reduce the chance that one extreme or outlier poll will skew the data.
As usual, we entered the polling data into our model and ran 40,000 simulated elections. Here’s what we get.
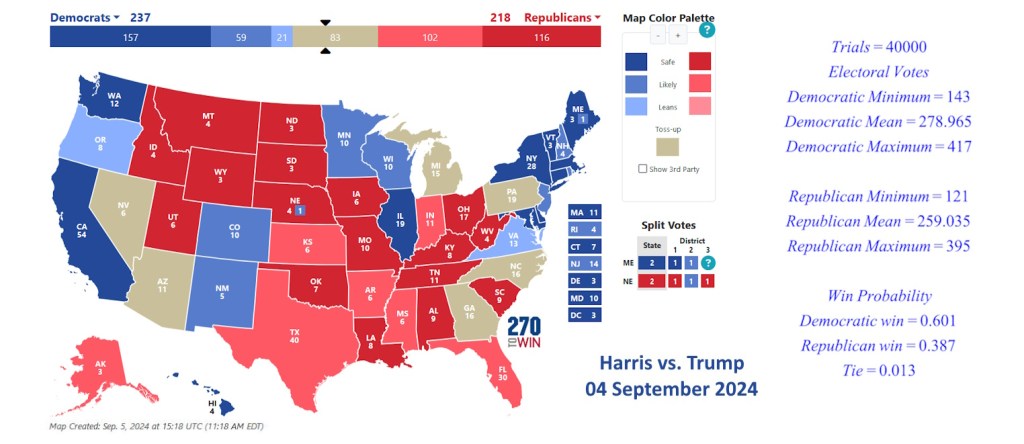
More states are showing as “Toss Up” than our recent updates, but light red, light blue, and taupe are very close together; this is not a dramatic change.
The results of the simulations tell us that the probability of Harris winning if the election were held today sits at 60% while Trump’s likelihood of victory is about 39%. One percent of the simulations ate ties.
This is where our results have been for a while, Harris still has a slight lead and the odds of her winning remain at about 3 to 2. But wait.
Trends:
I shifted methods so I’m not going to list the week-to-week changes. In the Electoral-Vote.com data, there’s some slight tightening in the race as evidenced by the larger number of toss-up states. Since I collected this data there was Nate Silver’s election probability, Trump’s pulled ahead on at least one betting site and Trump led the latest NYTimes/Siena College poll. Contrarily Harris is ahead in the FiveThirtyEight analysis with a 54% chance of victory.

We might be looking at a 50/50 race in out next update, but from our vantage point, the race as a whole seems stubbornly stable. In our model Harris’s advantage is driven by how many more electoral votes remain in the “Strongly Democratic” column vs. it’s “Strongly Republican” counterpart. Want to move our numbers? Get us a fresh poll in Indiana or Oregon depending on which side you’d like to help.
Last Words
I looked at something a little different this week and it’s interesting. While most of our analysis seems centered on the close races, let’s look at the ends of the red/blue spectrum. I ran a set of 1000 simulations and looked at the biggest landslides. The best result for the Republicans was a victory of 353 EVs to 185. The biggest win for the Democrats was 398 to 140. The maps for these might look something like this.

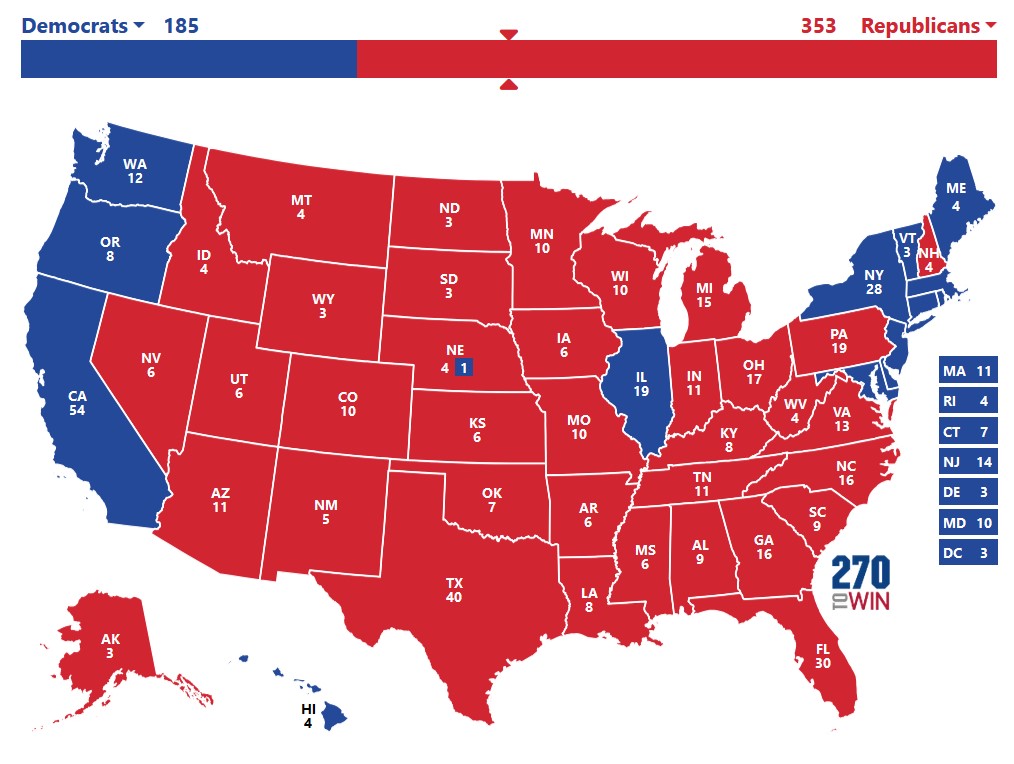
Neither of these are are going to happen; we won’t get close to either without a systematic polling error. Still, these look a lot more reasonable in the light of 270-to-Win’s polls only map; if you assume all the Toss Ups fall in one direction you get a Democratic victory of 390 to 148 or a Republican victory of 328 to 210. Stay tuned.

